Frequency Reports
Reports shows the delivery and performance numbers for your campaigns — the same figures as the metrics tab in CMP , without waiting for a report to be prepared. Choose what you want to see and the results arrive in a grid within seconds, ready to sort, adjust and run again.
That speed changes what you can use reporting for. A question you would have had to request and come back to, you can now ask and answer while you are still looking at the screen — and then ask the follow-up it raises. Nothing is a fixed layout: you decide which figures appear, how they are grouped and in what order, save the arrangements you want again, and send any of them to a colleague as a link.
Common Uses
- Checking that a campaign is pacing. Break the numbers down by day or by hour to see whether delivery is where it should be while the campaign is still running, instead of finding out afterwards.
- Seeing which versions of a dynamic campaign are delivering. Break down by ad unit version to find which versions are picking up impressions from a VAST tag, and which are not.
- Reporting back to a brand or an agency. When a campaign ends, group the totals the way the client asks for them, and send the report as a link.
Building a Report
Start from one of the ready-made reports listed down the side — Summary by Day, Publisher by Day, Creative Detail by Geo and others — or build your own.
Then set the scope: a date range, the timezone the numbers are counted in, and, when you want something narrower, the particular campaigns, flights, ad units or tracking methods to include.
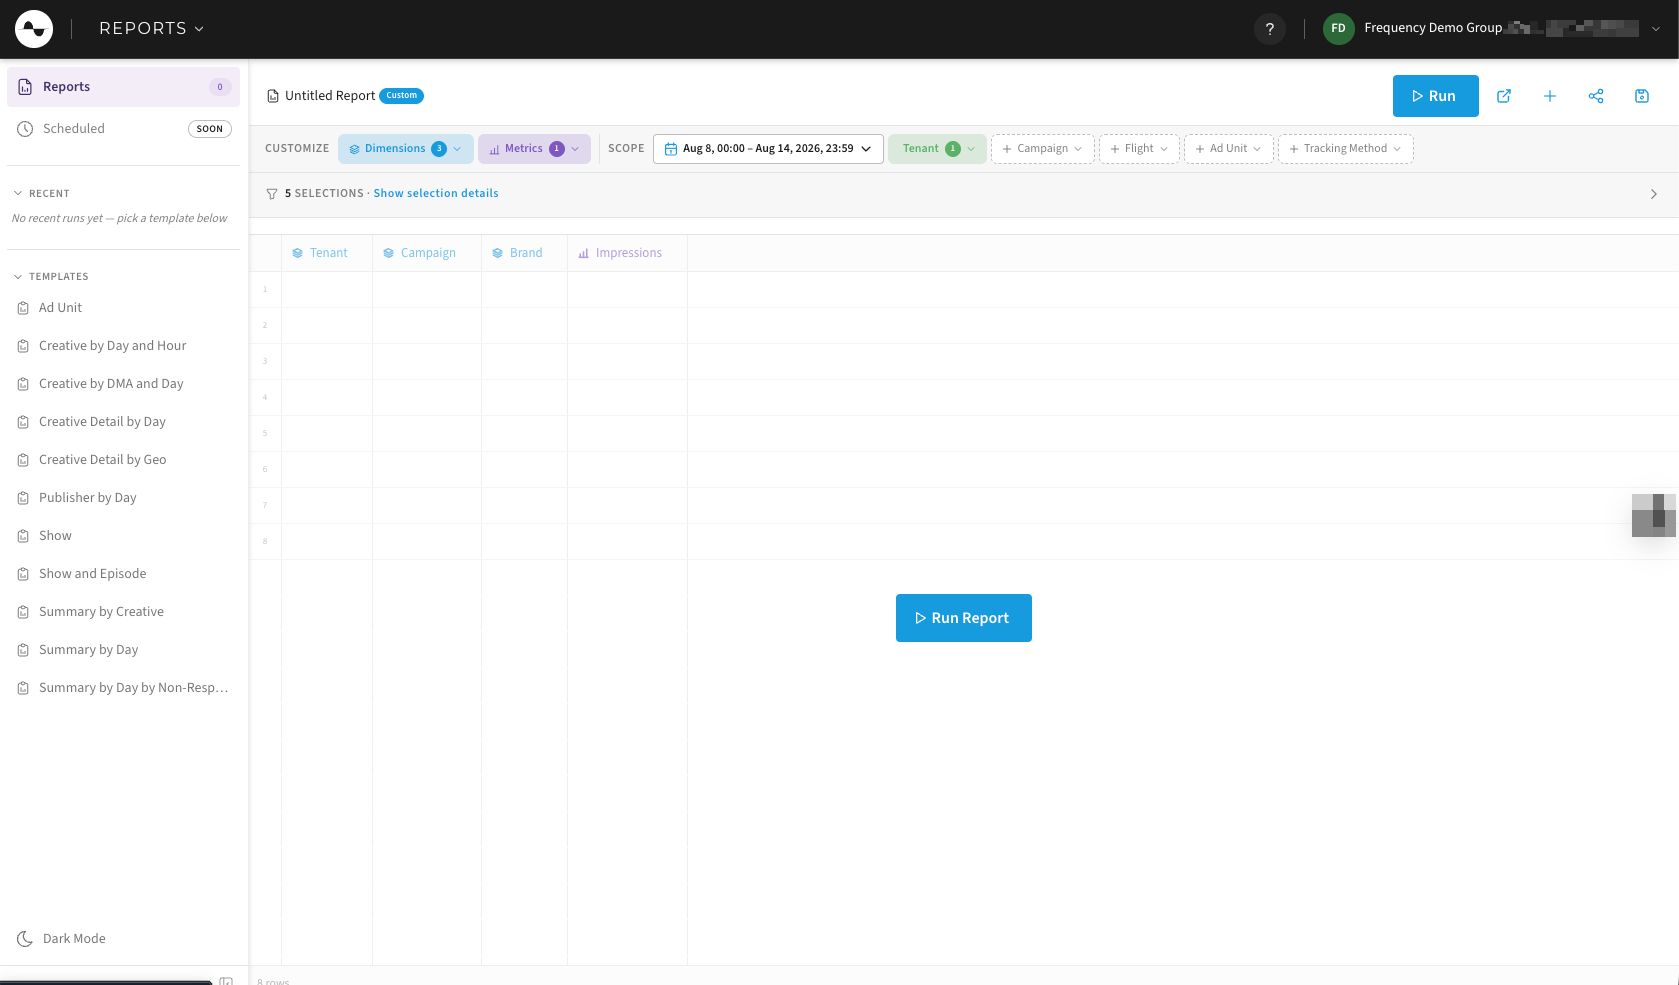
Results open in a grid you can sort by any column and rearrange to put the figures you care about first. Adjusting a choice and running again takes seconds, so it is normal to arrive at the report you want in three or four passes rather than getting it right first time.
When you land on an arrangement you will want again, save it as a template. It then sits alongside the ready-made reports as a starting point, so the next run is a click rather than a rebuild.
Customize
Two pickers decide what the grid actually contains. Change either one and run again as often as you like.
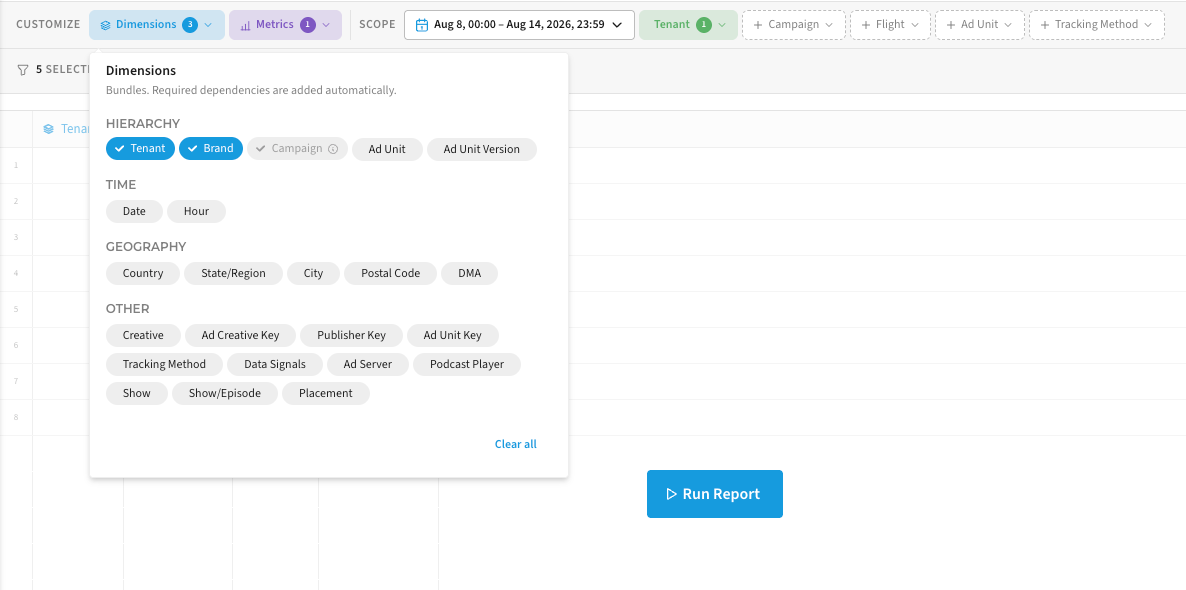
Dimensions set how the numbers are grouped: brand, campaign, ad unit and ad unit version; date or hour; geography from country down to city, postal code and DMA; and others including show and episode, podcast player, ad server, placement and tracking method. They come as bundles, so anything a breakdown depends on is added for you.
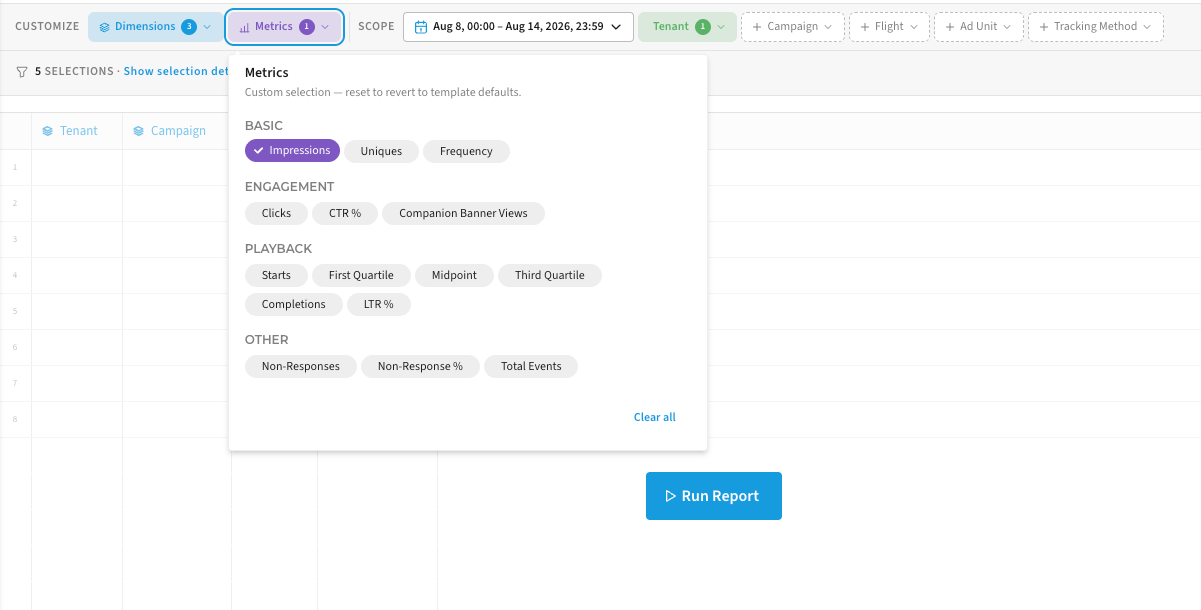
Metrics set which figures appear: impressions, uniques and frequency; clicks, CTR % and companion banner views; playback from starts through the quartiles to completions and LTR %; and non-responses or total events. A report starts with the metrics its template uses, and you can reset back to those defaults whenever a selection stops being useful.
Requesting Access
If you are a Tenant Administrator in CMP , email success@frequencyads.com to request access to Reports.
Reports uses a separate account from CMP . You will have two: your existing CMP sign-in, and a Frequency account for Reports. The email address has to be the same on both — that address is how Reports matches you to your CMP access, so with two different addresses it has nothing to show you. Customer success will take you through the rest of the setup.
Your access carries over as it stands: Reports shows you the same campaigns you can already see in CMP , and nothing beyond them. Once you are set up, sign in at reports.frequency.media .
Tip
If Reports tells you your access is pending, it means your account is not yet set up for it. Email success@frequencyads.com and we will take a look.